The Evolution of Female Representation in Uncanny X-Men
Introduction
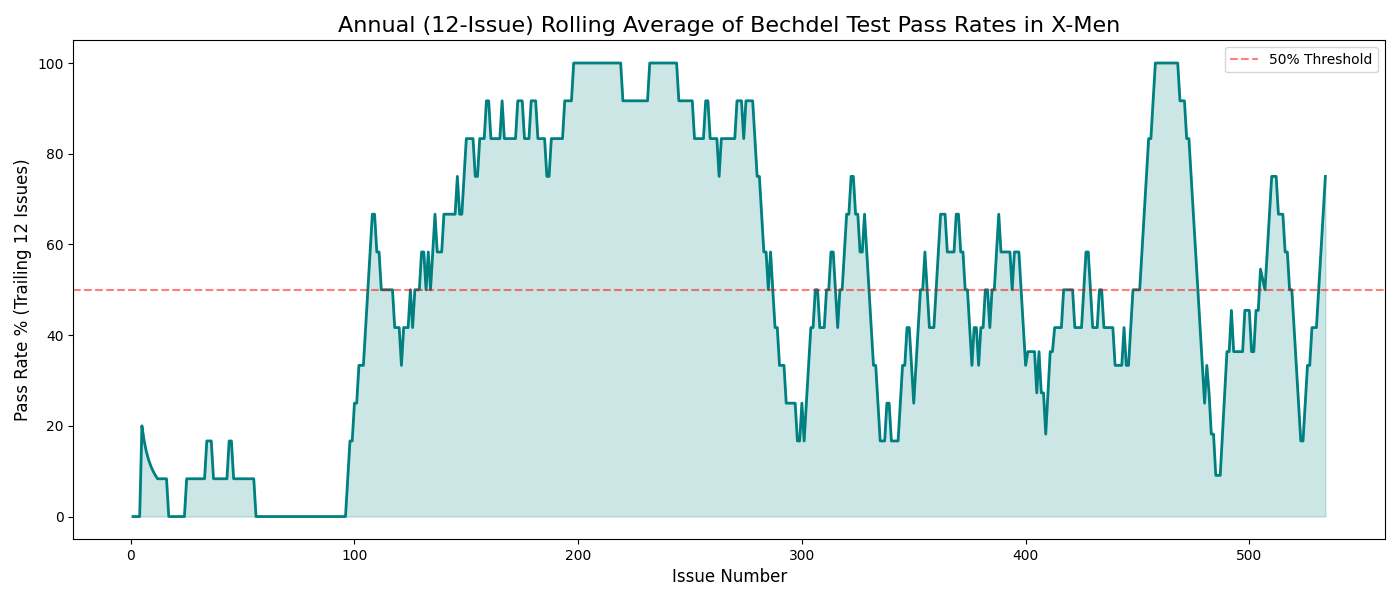
The primary goal of this project is to use the Bechdel Test to analyze how the representation of women in media has evolved over time, specifically within the publication history of Uncanny X-men. The Bechdel Test is a metric used to gauge female inclusion and independence in popular media. It asks whether a work features at least two female characters who converse with each other about a topic other than a man. To draw conclusions about historical shifts in representation, I utilized a dataset of Uncanny X-Men comics provided for our midterm project.
Rather than looking at random blocks of issues like the ones offered in the data, I calculated a 12-issue rolling average. Because standard comic books historically operated on a monthly release schedule, analyzing a trailing 12 issue window reflects the change that a new comic can bring and also represents consistent representations or misrepresentation of female characters. During the earliest issues, the comic almost entirely failed the Bechdel Test. However, right around the 100 issue mark, there is a massive spike in passing rates that sustains itself through issue 300, followed by a period of fluctuation in issues 300–530. This data tells us that a deliberate movement toward female inclusion and anti-stereotyping began near issue 100 and remained prevalent in the comic for a long time.
Process
To accurately visualize this narrative, the raw data first required cleaning. Several issues in the dataset were marked as "REPRINT" or were left blank. It was necessary to filter out and remove these rows, as reprints reflect the representation of the past rather than the creative decisions of that current year, and blank entries provide no analytical value and it would bias the data to assume values.
To conduct the mathematical calculation, I used Python. I utilized the Pandas library to clean the data, which included mapping the text values of “Y” (Pass) to “1” and “N” (Fail) to “0” so the computer could perform numerical calculations. By calculating the 12-issue rolling average, the data tells a much more meaningful story than looking at issues individually. It smooths out the graphs and allows us to see exactly when new writers, editors, and broader social movements fundamentally changed the comic's inclusion of women over a sustained period. Finally, I used Python's Matplotlib library to generate a line chart that visually graphs this momentum.
Presentation
To present my findings, I built a custom website using HTML to structure the content and CSS to style the visual presentation. In my HTML code, I utilized semantic tags for titles and paragraphs, and embedded the Python/Matplotlib created chart directly into the page. To style the presentation, my CSS code uses a class called “container.” This class gives the website a modern, professional aesthetic by generating a centered white "card" layered over a soft, light purple background. The CSS also includes shadows to make the card visually float on the page, and responsive image styling to ensure the data visualization scales to fit the screen size.
Significance
The significance of this project lies in using data to analyze a piece of media for systemic gender disparities and male centered biases. While superhero comics are just one small facet of media, they are a culturally massive one that heavily influences younger generations. It is vital to demonstrate that women can do all the same things that men can do and we need to give equal representation.
Projects like this are important for holding the media accountable and trying to dismantle misogynistic practices. While this project does have shortcomings such as lacking exact publication dates, containing some missing data, and focusing on only one comic title, it provides a strong analytical framework that can be used in similar projects. To derive a universal theory on comic media, one would need to analyze many different series. However, even with these constraints, the rolling average visualization successfully turns raw spreadsheet data into a story about the evolution of female representation in pop culture.
Sources
Throughout this process, I used data given to me about Uncany X-Men and the specific issues that passed the bechdel test. I also used Python and Matplotlib library to generate and calculate a graph showing the 12 issue moving average of issues that passed the bechdel test. Finally, I used W3 Schools online to find CSS code ideas. And finally I used classes from the Matplotlib library to write code to make a graph. I also used Polars and Pandas libraries to create data frames and calculations.